4 December 2020
Load testing with Locust

metrics
There are lots of tools around to help load test your applications. However, it's hard to select one that just fits. The better ones seem to be in the cloud, which is ok until your server is internal only.
Locust.io
I recently found locust.io and I am excited about it and that's mostly because I get some pretty charts. I appreciate charts in load testing because it can highlight things that aren't easy to identify from the bulk stats.
For example, I recently identified an issue with cold boots since the chart clearly showed a latency spike on the first call only. I could also clearly see that the 95th percentile became unstable as the requests per second exceeded a particular number.
It's also got the ability to ramp up your requests quickly or slowly. Actually, you ramp up your users which can be good or bad depending on whether your target is total user count or requests per second.
The downside - python
I'm sorry, but I don't do Python and locust runs python scripts. That makes things problematic. That said, everything else is great, so maybe I can overlook this part. I understand there are going to be a lot of data scientists out there thinking this tool has come straight from heaven.
Containers
I love when tools have nicely wrapped container images for getting up and running quickly and easily and it's not just because I'm a container fanboy! To run this application, you will need a docker-compose.yaml file and a locustfile.py in a folder. Execute docker-compose up and you're away! Docker will download the image, map the volume, run a master and a worker service and map the port. Once complete, the locust UI is waiting for you at http://localhost:8089.
If you want more workers, you can start it with
docker-compose up --scale worker=4to get 4 workers instead. Simple!
docker-compose.yaml
version: "3"services: master: image: locustio/locust ports: - “8089:8089” volumes: - ./:/mnt/locust command: -f /mnt/locust/locustfile.py —master
worker: image: locustio/locust volumes: - ./:/mnt/locust command: -f /mnt/locust/locustfile.py —worker —master-host master
Request scripting
Sometimes you just need to hit a single endpoint to get an idea of how things are performing. I've made a basic file for doing this below. This is pretty much the simplest config you could use.
locustfile.py
from locust import HttpUser, task
class MyUser(HttpUser):
@task
def homepage(self):
self.client.get(’/’)
Locust also allows you to create a task set of actions and tie to a type of user. The task set can be sequential or can be random. You can weight the method so that one step runs more often than others. You can set up a login step and have it run before running anything else. You can configure wait times between requests, select random ids from a text file and many other things. It's just ... well, python.
Anyway, that's all detailed in their documentation. If it sounds like your cup of tea, check it out here.
Visualisation
To show off some of the charts, I ran some load testing on my blog. Now, my blog runs on a tiny machine, but I was still surprised to see it max out at 5 requests per second.
To get to this result, I ran locust and browsed to http://localhost:8089.
In case you forgot, run
docker-compose upto get it all started.
You will start with this screen:
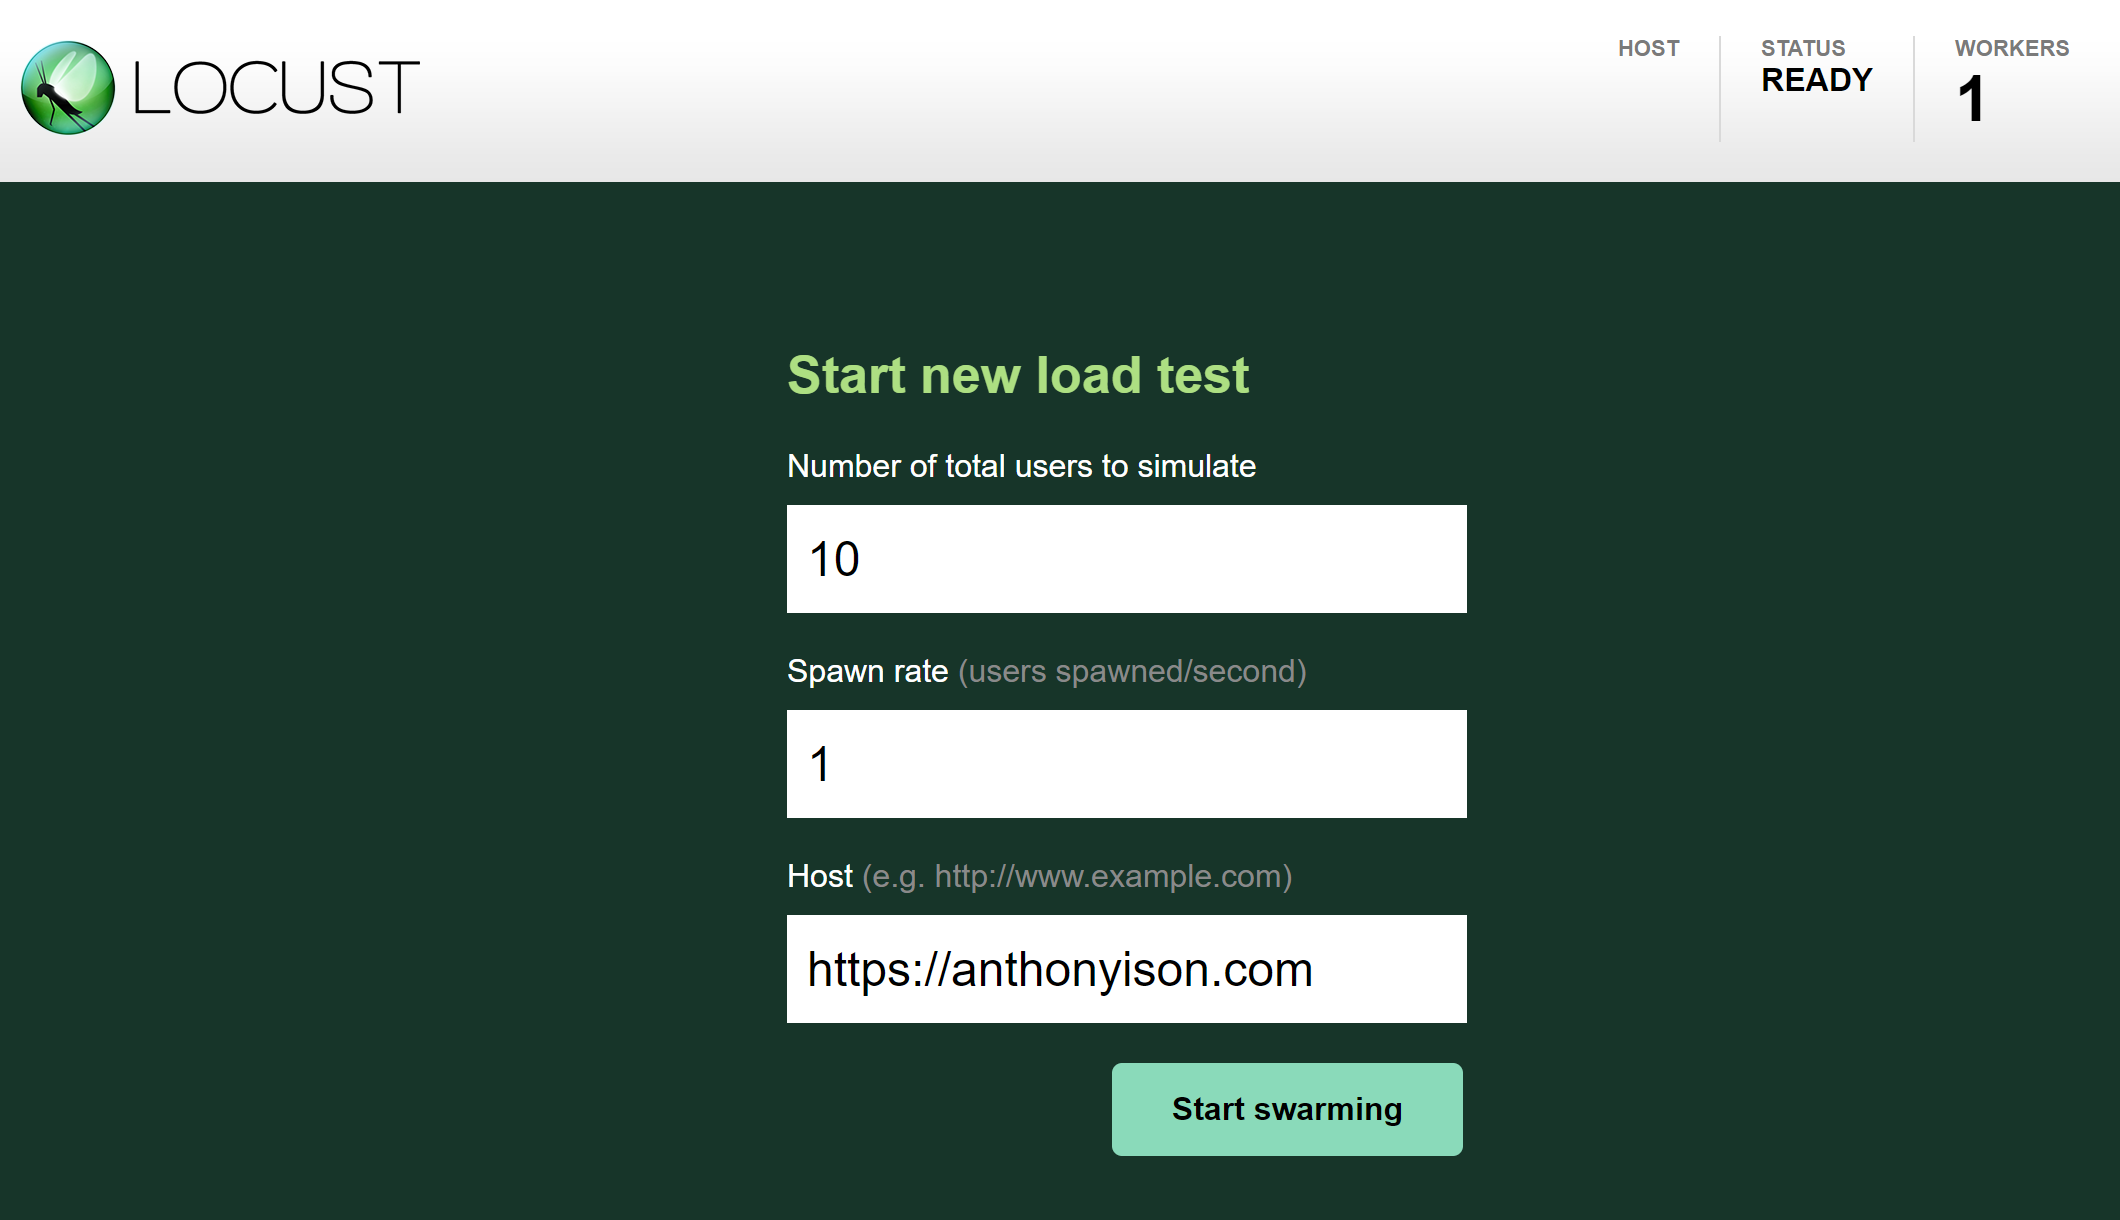
Figure: Start screen
I used an initial count of 10 users, adding 1 per second. The latency immediately shot up to 5 sec per request. I figured my site runs faster than that, so I clicked 'Edit Test' and dropped down to 5 users. The response time dropped but the requests per second (RPS) stayed even. Then I dropped to 2 users and then to 1 user. Eventually, my RPS dropped below 5 and it was at this point that I could see my site's natural latency. Boosting back to 2 users restored the total RPS without impacting latency (too much). The yellow line (95th percentile) does jump up slightly. So, around 3 RPS (1 user) is pretty stable. 5 RPS is max speed. Adding extra users at this point will only increase latency.
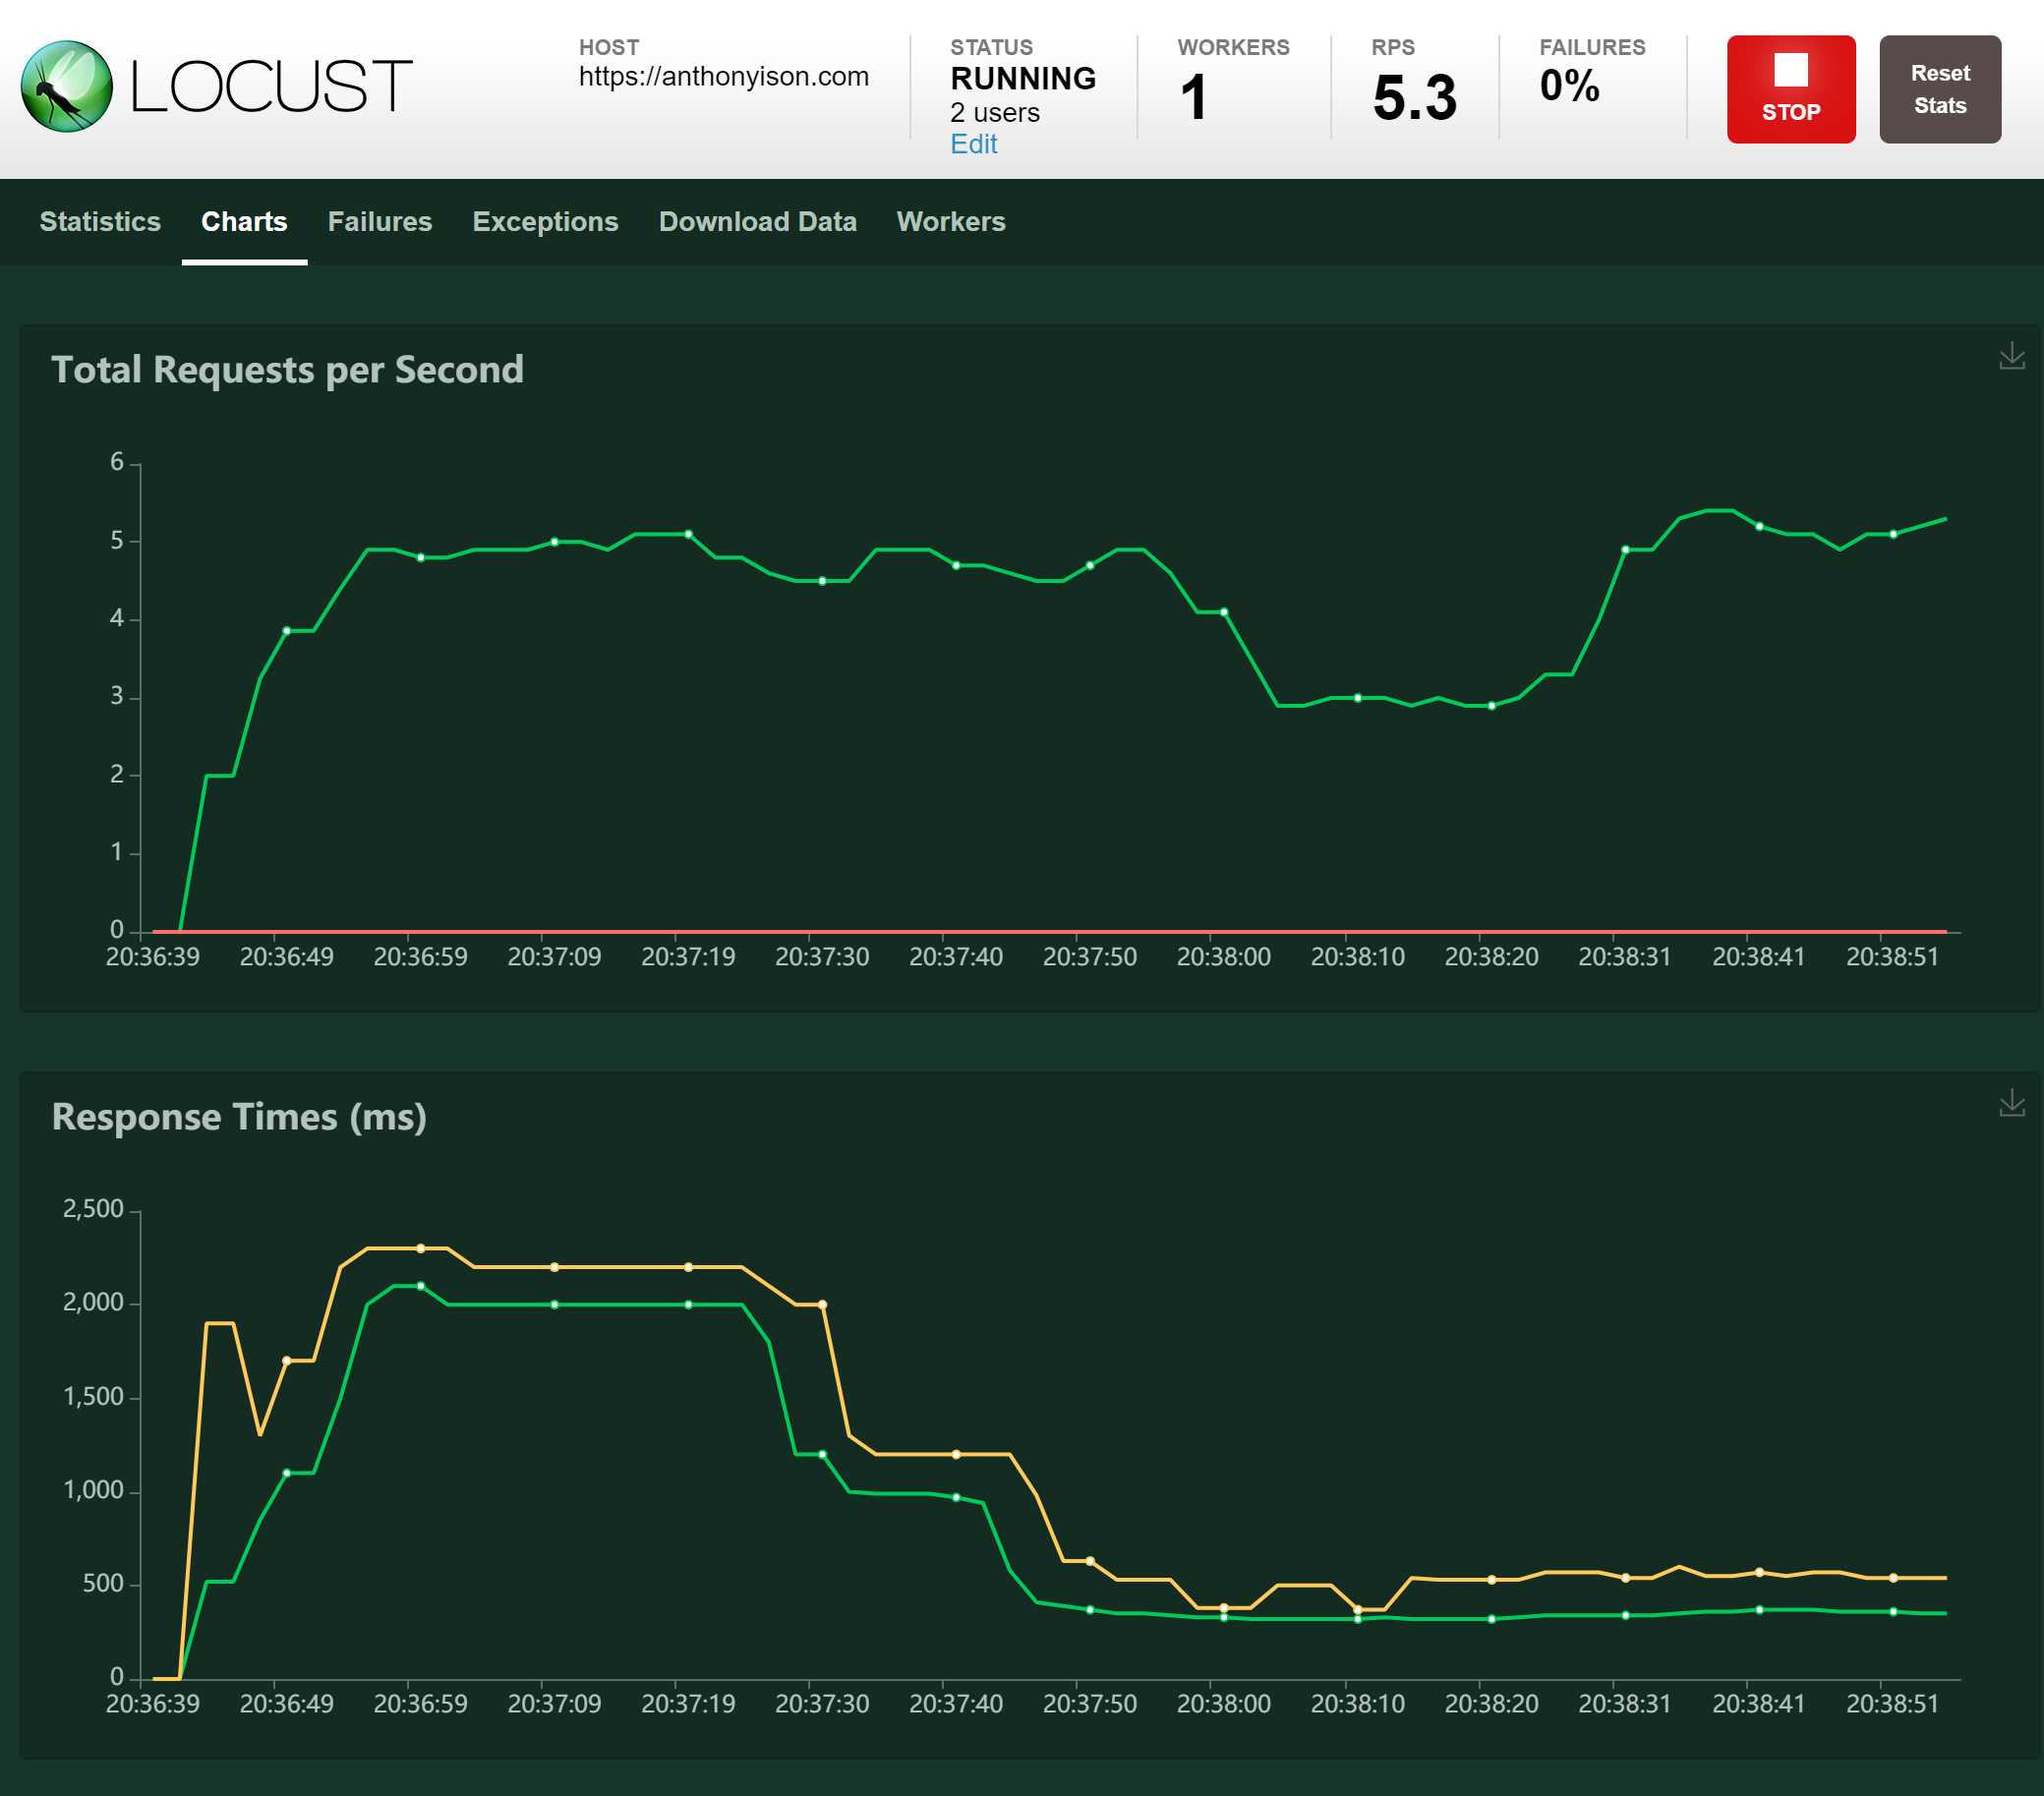
Figure: Locust chart showing results of changing user count
Locust also has Failures to show what percentage of requests fail and the status code. There's a Worker tab which will reveal the CPU percent used per worker.
There's also the Statistics tab, below, that shows the standard min/max and average for the requests per endpoint hit.
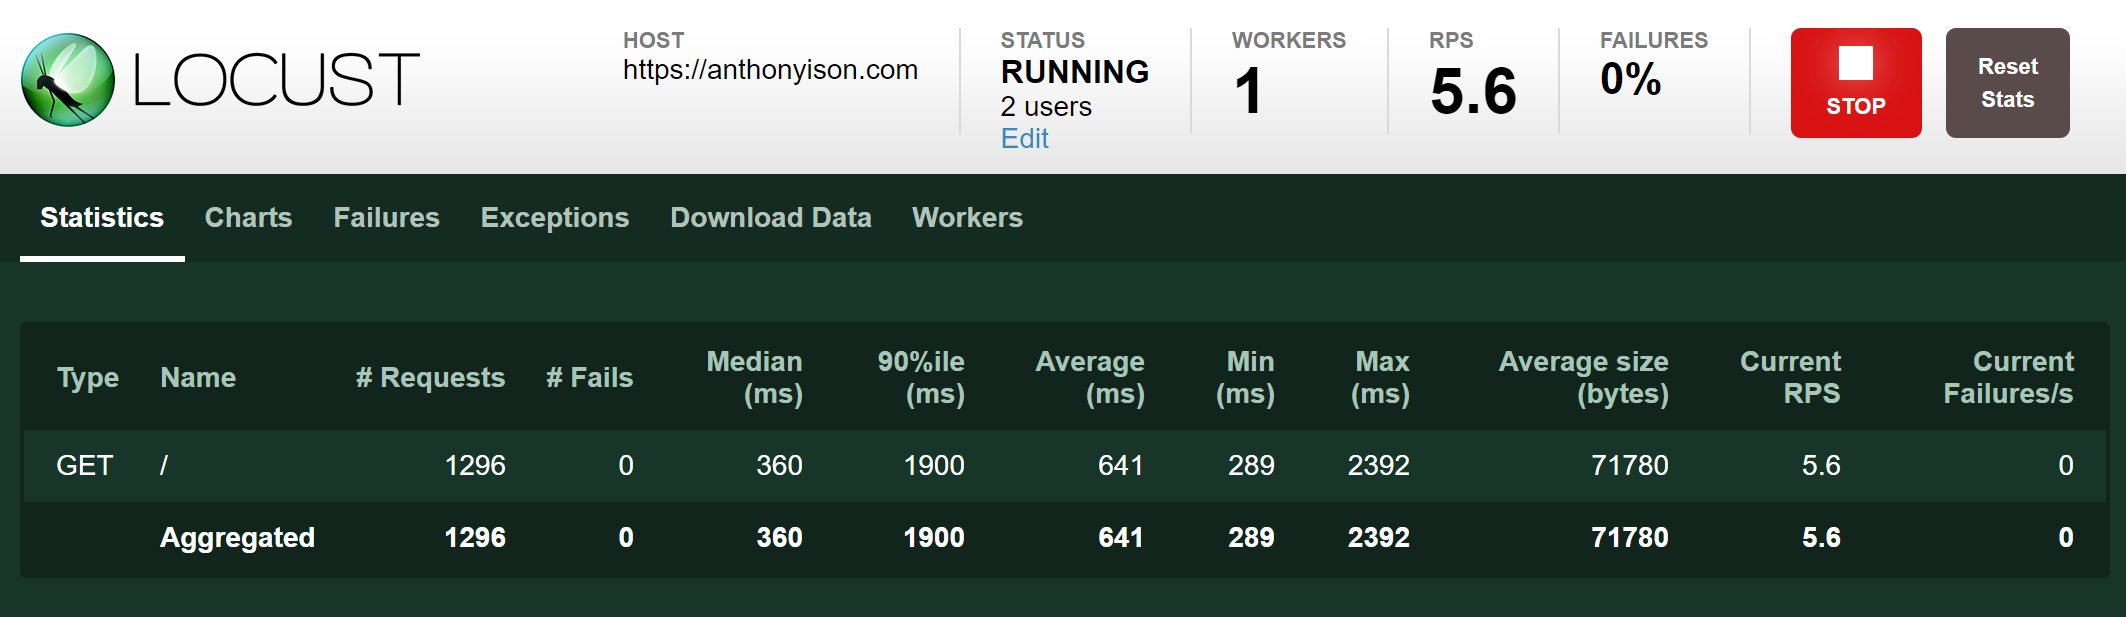
Figure: Statistics screen
Summary
So that's Locust! It's a great tool for getting in there and poking around with server performance or you can use it to set up some baseline site activity before running other tests.
The visualisation is really useful for identifying where things are going awry. It will certainly remain as a tool for my utility belt.